
Agrim Agrawal
Data Analyst

Google Play Store Analysis Using Python
The task is to understand what makes an app perform well - size? price? category? multiple
factors together? Analyze the data and present your insights in a format consumable by
business – the final output of the analysis would be presented to business as insights with
supporting data/visualizations.

Latest Covid-19 Analysis
Demonstrated proficiency in data manipulation, statistical analysis, and data visualization tools, such as Python, R, and Tableau. Overall, the project demonstrated a strong ability to analyze complex datasets and provide data-driven insights to combat the COVID-19 pandemic.

IPL-Data-Analysis
In this Analysis we find some insights which are mentioned below
(1) Tosses and Matches won by each team
(2) Stadiums with maximum match occurance
(3) Count of bat/bowl decision by each team on winning the toss
(4) Top run scorers
(5) Number of matches played by each team
(6) Probability of winning the match by winning the toss
(7) Percentage of teams electing to bat in every season
(8) Number of man of the match awards received by each player

Amazon-Movie-and-Tv-Rating-Analysis
Performed a comprehensive analysis of movie and TV ratings on the Amazon platform to gain insights into customer preferences and improve recommendation systems. Utilized data mining techniques to extract and clean large datasets, including user reviews, ratings, and metadata.
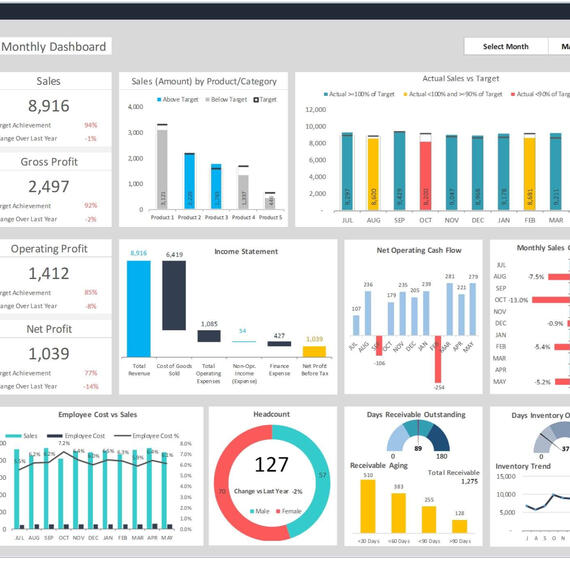
Interactive Dashboard
Developed interactive dashboards in Microsoft Power BI to provide insightful visualizations and data-driven decision support. Designed and implemented user-friendly interfaces that allowed stakeholders to explore and analyze complex datasets with ease. Leveraged advanced Excel features, including pivot tables, data validation, and conditional formatting, to create dynamic and interactive visualizations. Incorporated interactive charts, graphs, and maps to effectively communicate key metrics and trends.